
Links between Risks, Controls, KRIs and KCIs, and their effect on thresholds and risk appetite
Here Tony and John discuss the links between risks, controls, KRIs and KCIs and managing them through operational risk software.
Taken from: Mastering Risk Management
It is common to identify a considerable number of indicators for each key risk. The challenge is to find a small number of indicators which convey information that is useful to the business, preferably using existing management information. Ideally, there will be one or two indicators for the likelihood and impact of a key risk and one indicator for each control which mitigates the key risk. In this way it is possible to achieve a manageable number of indicators which will give a good picture of the current risk profile of the firm.
Thresholds and Risk Appetite
Establishing targets or thresholds linked to an indicator can be very useful in setting escalation criteria for management action and in assessing trends in indicators. Thresholds should be set by reference to the business needs, and willingness to take a specific risk or to accept a level of control failure. The starting point is the required risk profile for the business.
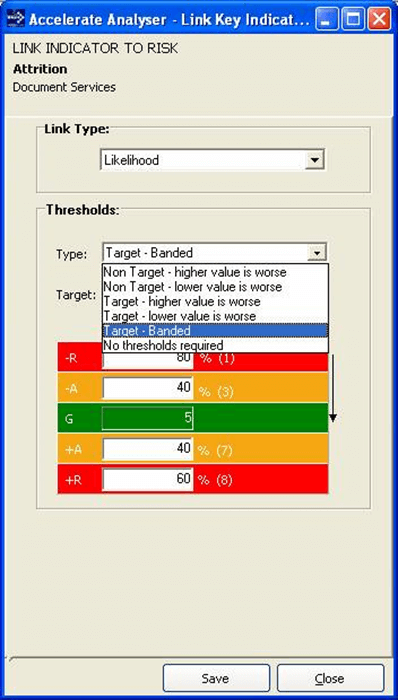
In the example shown below, a mean target has been set of 5 with a green band of 4 to 6. The indicator has bands on both sides with an amber band of 3 or 2 on the lower side and a value of 7 on the upper side. These bands represent a breach of risk appetite: 1 or below is in the lower red band and 7 or above is in the upper red band. At this level there has been a significant breach of risk appetite. This is an example of an indicator which is bounded on both sides and which has uneven bands.
It is also common for indicators to have one-sided bands, for example a [green ] band of 0 and 1, an [amber] band of 2 or 3 and a [red] band of 4 and above. Indicators can also be binary: that is they move directly from a green band to a red band. An example of this type of indicator might be the number of fatalities on a construction site.
Clearly these bands should be linked to the appetite of a firm and can be the qualitative (red, amber, green) part and quantitative (numerical) part of risk appetite.
Validation of thresholds through experience
Thresholds can be validated through reviewing previous indicator data, where they are available, and through a review of the losses incurred by the firm which are relevant to the specific risk control. In addition, threshold validation can sometimes be achieved by examining peers’ or competitors’ losses.
When looking at validation data, however, remember to allow for data which change in different periods. For example, the number of non-productive days due to staff absence will be higher in the summer, when holidays are traditionally taken, than in the spring or autumn.
Predictive Risk Management Indicators
Risk indicators are sometimes able to show when risks are more likely to occur; they can give early warning signals before risks happen. The challenge for risk management is to identify which indicators are most likely to give the early warning signals, in other words the ones which act as effective leading indicators. Clearly, indicators that the risk is more likely to happen, likelihood indicators, are a good place to start as these provide warnings before the risk event has occurred. Equally, indicators about the impact of a risk event are lagging indicators and will tell you about the effect of the risk when it has happened, and the likely size of the impact. However, there is not necessarily a correlation between an indicator’s numeric value and the final size of the impact. Indicators tell you that the world may have become riskier, but not by how much.
For control indicators, a helpful technique is to use an internal audit methodology of classifying controls. This divides controls into four categories.
- Directive controls – controls which mitigate a risk through direction (e.g. policies, procedures, terms of reference)
- Preventative controls – controls which mitigate risk through preventing it happening (e.g. guards round a piece of machinery)
- Detective controls – controls which mitigate the impact of a risk (e.g. fire alarms or accounting reconciliations)
- Corrective controls – controls which mitigate the impact of a risk through correcting the effects of an event (e.g. disaster recovery site)
It is clear that indicators of preventative controls are leading indicators, whereas indicators of detective controls will provide information about the likely size of an event and are lagging indictors. The good risk management practice of having a balance of directive, preventative, detective and corrective controls to mitigate a risk is therefore very helpful in identifying leading and predictive control indicators. This technique also provides a valuable challenge to the management of risks in that the risk owner is able to see whether or not the mitigation of the risk is balanced with a similar number of controls operating before and after the event has occurred.
Reporting Risk Management KRI Data
Indicators for a number of key risks relating to a single department or a firm are commonly reported on dashboards where a red, amber, green status column is very common together with a trend indicator. This provides a quick view and guides the dashboard users as to which indicators to focus on first. It is also common to record the most recent three, six or twelve month periods and to have an average of the most recent three in order to smooth the volatilities in the indicators. Combinations of indicators can also tell stories.
Action Plans
Collecting and monitoring indicators is of no use unless action is subsequently taken. A firm will clearly wish to take action if a leading indicator shows that the risk is more likely to occur. Action plans raised by indicators will be similar to other management action plans in that they will include the objective to be achieved through completion of the action plan, the expected date of completion, the owner of the action plan and other typical items. However, there will also be reference to the control which is failing (if applicable), the risk which has been identified as more likely to occur and the possible impact to the firm if the risk does occur. These points, which are linked explicitly to an indicator, will be helpful in preparing a cost-benefit analysis for the action plan.
KRI reports often include reference to the action plans. If a KRI is in the red zone action is needed. As with all actions plans, it is important to monitor it to ensure that the target completion date is achieved. However, with KRIs that are outside of the firm’s appetite it is vital to confirm that the target date will be met.
Summary
Indicators are valuable not only in monitoring business performance, but in identifying changes in a firm’s risk environment and in the effectiveness of risk controls. They are a fundamental part of the risk management process and an essential part of monitoring quantitative risk appetite.
The important thing to remember is that a KRI is an indicator of a key risk and a KCI is an indicator of a control which relates to a key risk. If that is understood, the number of indicators will be manageable and the business will see them as valuable, thus helping to achieve buy-in for the whole risk management process.
Mastering Risk Management by Tony Blunden and John Thirlwell is published by FT International. Order your copy here: https://www.pearson.com/en-gb/subject-catalog/p/mastering-risk-management/P200000003761/9781292331317
For more information contact us today on sales@risklogix-solutions.com